Is your cannabis retail business struggling because of clunky administrative tools and business reports that don’t provide the whole picture? Wrong or outdated data about your inventory, sales, and cash flow can negatively impact your company’s bottom line.
TechPOS delivers clear, easy-to-implement reporting on every aspect of your cannabis retail business. Streamline your process and gain deeper insights with reports that break down every aspect of your operation.
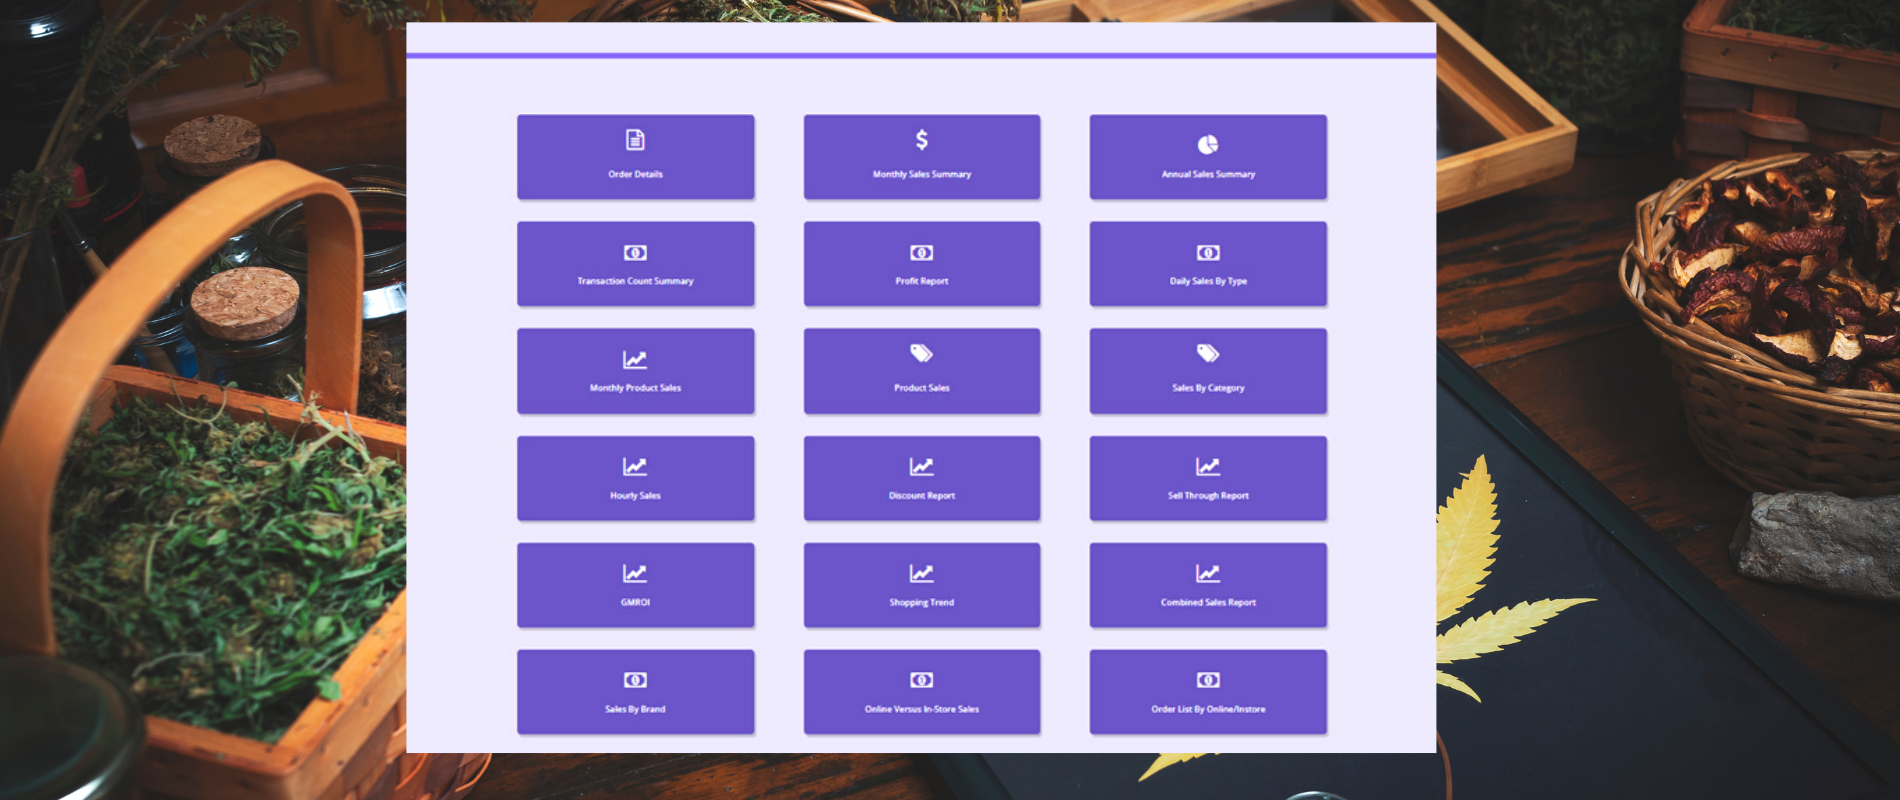
Types of Business Reports You Should Be Using
Depending on your sales setup and administrative tools in place, you may already be getting some reports. However, these reports may not be up to date with real-time data, and you could be missing crucial pieces of the big picture.
TechPOS reports give you comprehensive insights into how your cannabis retail business is really doing. Here are some of our most popular and useful reports (check out the full list of our reports here):
1. Sales by Category
This report gives you the total sales for each category and what percentage of all sales that category brought in for a specified time period. Break down sales on a category-by-category level to see which ones are performing best, and apply this knowledge to your marketing strategy.
2. Hourly Sales Breakdowns
Your hourly sales can be easily visualized with this business report. Learn when your stores are busiest, and compare traffic and sales between your online store and your physical locations. Use this information to create time-specific promotions to boost traffic and sales during historically slow times of day.
3. Daily Cash Flow
This report provides a summary of your transactions for the day. It shows your daily number of orders, dollar amounts for daily sales, cash refunds, and cash-in and cash-out amounts. Monitor daily cash flow to see what is occurring in your safe and bank accounts.
4. Budtender Sales
This report allows you to view employee performance by branch location, based on hours worked and sales made. Compare your staff to see how fast they make transactions and what they are selling, and make decisions about raises, promotions, and terminations based on hard data.
5. Daily Inventory
This is a snapshot of your total inventory in an easy-to-read list format. It shows you exactly what you have on hand and where, as well as all product details at any time. Leverage this data to stay ahead of stocking issues and to identify dead inventory that can negatively affect your cash flow and profits.
6. Monthly Inventory
View details on each product you sell, including product type, category, SKU number, total sales amount, and quantity sold of each product. Identify bestsellers and look for ways to boost sales of languishing inventory.
7. Manual Inventory and Price Changes
These business reports let you readily access every manual inventory change made within the system. Track when changes were made, where, and by whom, to reconcile your total inventory and sales profits across all locations.
8. SIGMA Business Reports
This report provides information on all movement and Cost of Goods Sold (COGS). You can review gross sales, cost of opening inventory, cost of closing inventory, and more. Be ready to supply this report when your accountants request this data.
9. Reorder
This report details your current inventory of any product, how many units were sold in the last week, and the dollar amount of the product sold. Use this report’s forecasting function to determine how much product you need to order to meet the upcoming week’s sales demands.
10. Budget Planner
Maintaining a healthy inventory is critical for positive cash flow and maximized profits. The report helps you determine what to order for each category, and even how much of each specific product based on your budget.
11. Aggregate Reports
Aggregate reports are especially useful if you have multiple locations.
- The Aggregate Branches Report provides you with information about the total amount of products sold, total sales and profit, etc. from all of your branches.
- The Aggregate Sales Report visually represents all of the sales in dollar amount across all branches for each month up to the current date.
Use this data to track dips and rises in customer demand, project future sales, and compare every detail between your branches.
12. Member Demographics
Find out who is shopping with you and their preferences, so you know what to stock and promote.
Start Leveraging Business Reports Today
Reports can be a powerful tool for measuring the success of your cannabis retail business. TechPOS currently provides more than 40 distinct reports to help streamline your administration process, helping you grow and expand your business.
Contact us today to learn more about the TechPOS solution for cannabis retailers.